
This work is sponsored in part by a grant from NOAA Sea Grant administered by Washington Sea Grant and the University of Washington. Additional funding is provided by the U.S. NOAA Office of Aquaculture in a grant to Alan Everson, Pacific Islands Regional Aquaculture Coordinator, NMFS, Pacific Islands Regional Office in Honolulu.
The overall goal of this project is to validate AquaModel software as a tool for government and industry use in managing net pen aquaculture siting and operational environmental effects. In the U.S., NOAA's National Ocean Service has recently provided more evidence that high quality seafood protein can be sustainably produced using net pens, after conducting an extensive literature survey and review (Price and Morris 2013). Yet there are few quantitative tools to plan farm sites, either individually or for cumulative effects of several sites in a region.
AquaModel provides the capability for industry to optimize production and government to insure minimal or no adverse water column and benthic impact.
Most aquaculture models in the past have not been validated at all, but rather developed and applied with little or no consideration for proving their effectiveness and flexibility to the widely differing conditions that exist throughout the world's oceans. A few models claim to have been validated, but without exception, these were limited to one or two geographic regions and often done by means that provide surrogate information, such as the use of tracer techniques that do not perform the same as the particulate and dissolved, organic and inorganic wastes from net pens. Accordingly, they were not really validated.
We have applied AquaModel for a number of years worldwide and always seek to use site or regional-specific calibration factors, but these alone do not assure that the model output will be reasonably accurate.
The architecture and even most of the operative equations involving AquaModel are available in reports on our web site publication page. Here instead we concentrate on validation efforts.
Model Validation Approaches
For us, model validation involves several steps and has evolved over time.
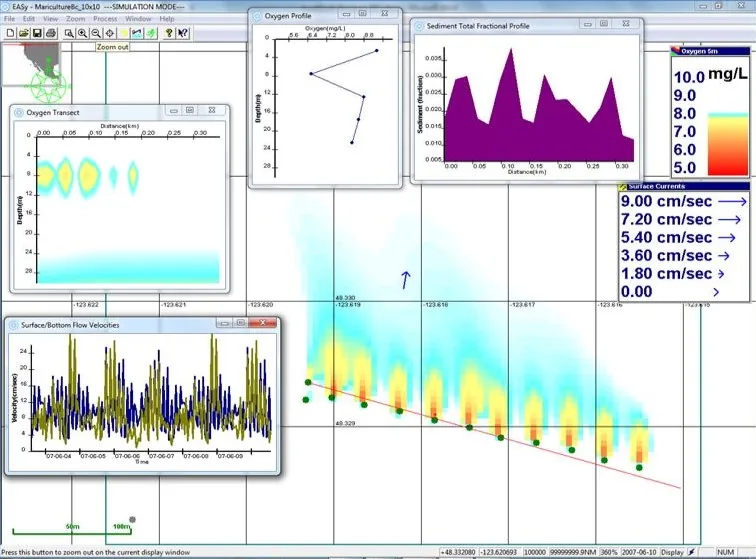
First, we calibrate AquaModel with local coefficients available from the literature, site-specific data, or unpublished government or academic sources. We then run the model while varying several of the less-well-known parameters to estimate the range of outcomes compared to measured data. When we see discrepancies, we determine if these are due to calibration or model construction causes by a combination of trial and error, applying debug code, and using the variety of tools and methods built into the model to express the mechanics of the model operation.
Over the years we have found that our conceptual model of how AquaModel should process data had to be altered, to account for discrepancies. We started with a simple mathematical interpretation of the various processes involved, but in some cases have added refinements to more closely approximate natural processes. Each time this occurs, we are obliged to conduct a series of tests and tuning exercises to determine the result of the model changes.
There are many formal types of sensitivity analyses that can be applied to model performance testing. We are now involved in some of these too, but continue to rely on the tools provided within AquaModel to begin to assess the effects of different unknowns.
Major Factors Affecting Model Performance
Without question, the physical oceanographic processes driving aquaculture models are among the most important factors influencing the models. We use 2D (two dimensional) or 3D (three dimensional) data to power AquaModel. The 2D systems are usually current meter data and these are simple to input into AquaModel. But in recent years floating aquaculture facilities have grown in size to the point where single current meter inputs do not adequately describe many operations and lead to significant errors in model estimates versus observed results. There are no simple or common means to integrate more than one current meter dataset into a combined system, so rather we resort to 3D models when possible.
3D models have been used in AquaModel for analyzing the far-field effects of several fish farms along coastal areas, such as in the Gulf of Maine, the Island of Hawaii or in the Arabian Sea (see publications page of this web site). To date, the major limitation with existing 3D models has been the spatial resolution, often at 1 km or above which is too large for use around single fish farms. However, this is changing rapidly with the development of high resolution versions of several existing circulation models.
We believe the future of aquaculture modeling in coastal and open ocean environments revolves around these powerful and accurate 3D circulation models to provide the physical drivers of water motion. To this end, we have created routines to import data from the leading far field circulation models such as ROMs (Regional Ocean Model), FVCOM (Finite Volume Coastal Ocean Model), ADCIRC (U.S. Army Corps of Engineers Advanced Circulation Model), and NCOM (Navy Coastal Ocean Model). Each model has its own AquaModel routine to import and pre-process the data so that the data can be altered from the non-gridded to gridded structure. AquaModel operates quickly and efficiently on a normal PC for a number or reasons but in part because we use a gridded, Cartesian coordinate scheme to represent the modeling domain.
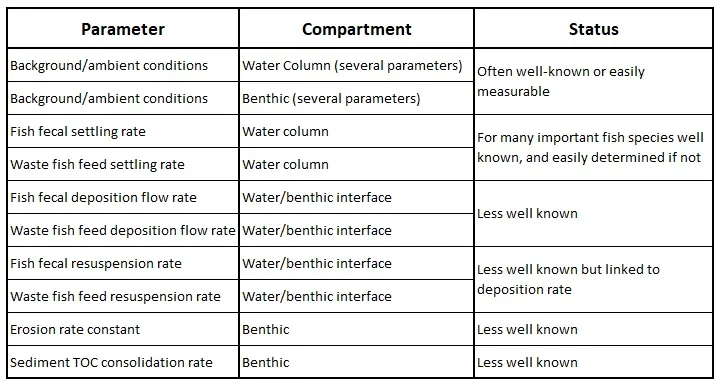
Within AquaModel there are many parameters that require calibration. The following table summarizes most of these and their current status regarding how well they are known. Focusing on the final six that are less well known, there are many different combinations that could be assembled with differing values. Obviously, this is an area requiring a sensitivity analysis, and we are engaged with our collaborators in addressing this need.
Study Sites
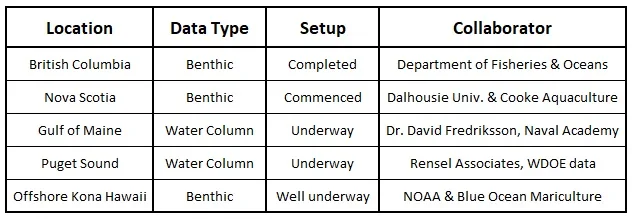
The table below reviews the status of the five field projects we have been using for AquaModel validation. By necessity we are working with collaborators in other countries (e.g., Canada) where some of the best possible data sets are available.
Out-Reach Activities
Dr. Rensel, Dr. Kiefer and Mr. Siegrist have traveled extensively in the U.S., the Arabian Peninsula, Chile and eastern Canada during the past decade. More than a dozen separate presentations and seminars were given at scientific meetings and special events. In 2013, Dr. Kiefer and Dr. Rensel gave a four-day training workshop in Vina del Mar, Chile to 18 scientists from the Chilean Government; Mr. Siegrist led a later workshop in Valparaiso, Chile in 2015. Dr. Rensel held a two-day workshop was given in Saint John, New Brunswick in February 2014 with about 20 participants and collaborators. Dr. Kiefer and Mr. Siegrist have also held training sessions and workshops in Los Angeles, CA; Monterey, CA; Muscat, Oman; Mumbai, India; and Mombasa, Kenya.