
About
Published Study:
Salmon farm study in the Strait of Juan de Fuca, Washington
The images below represent a salmon farm study in the Strait of Juan de Fuca, Washington. For details about the project, see the Strait of Juan de Fuca study funded by the NOAA Office of Oceanic and Atmospheric Research and read the published results here.
- Location
- Western, central and eastern Strait of Juan de Fuca, Washington
- Study
- Feasibility of offshore marine or salmonid finfish culture
- Funded by
- NOAA Office of Oceanic and Atmospheric Research
- Reports
- Rensel, J.E., D.A. Kiefer, J.R.M. Forster, D.L. Woodruff and N.R. Evans. 2007. Offshore finfish mariculture in the Strait of Juan de Fuca. Bull. Fish. Res. Agen. No. 19, 113-129.
Rensel, J.E. and J.R.M. Forster. 2007. Beneficial environmental effects of marine net pen aquaculture.
The images below show screenshots of our salmon farm model. The first figure (Figure A) is a representative screenshot of selected outputs of a calculation with our model. The central map in the screenshot displays a portion of the rectangular array that was placed at a possible site for a salmon farm in the Strait of Juan de Fuca.
The farm, which occupies a single element and is simulated to contain a high density of fish (22 kg per m3 of fish, average weight is 0.5 kg), is placed in the center of the array (red dot). The green plume is a false color image of the plume of oxygen-depleted water that was created by fish respiration within the farm. During a simulation, the plume spreads toward the east during the flood tide and then recedes and spreads to the west during ebb tide. The magnitude of the oxygen deficit within the plume's core will also vary with tidal flow, being highest during slack flow and lowest during peak current flow.
The red line is a transect that runs through the centerline of the plume; it yields a vertical contour plot of oxygen vs. depth that is shown in the lower left-hand corner of the figure. We see from this figure that the concentration of oxygen is lowest in the farm, and that the oxygen-depleted water is found within the upper 10 meters of the water column, which is the depth of the farm. These results are consistent with field measurements but are exaggerated here for the sake of demonstration by having very high density of fish in the farm. Normal oxygen deficit plumes from commercial salmon farms are no longer than about 30 m downstream, and usually much less (Rensel 1989, Heinig 2000, Rensel unpublished NPDES 1986-1995 data). Similar dynamic 3-dimensional views of the "farm's waste plume" for other variables of interest such as dissolved nitrogen and phytoplankton can also be displayed simultaneously. The plots at the top of the screen show the vertical distribution of oxygen within and below the farm (left) and the time series for current velocity (right). The plot at the bottom right corner is the time series for the growth rate of the fish. Figures B and C show model outputs with some of the available sediment plots.
Figure A. Simulation outputs for a salmon farm in the Strait of Juan de Fuca with oxygen plume exaggerated for the sake of display by virtue of higher than normal stocking density of fish.
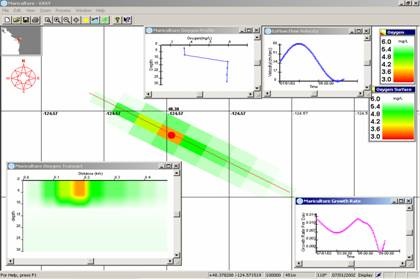
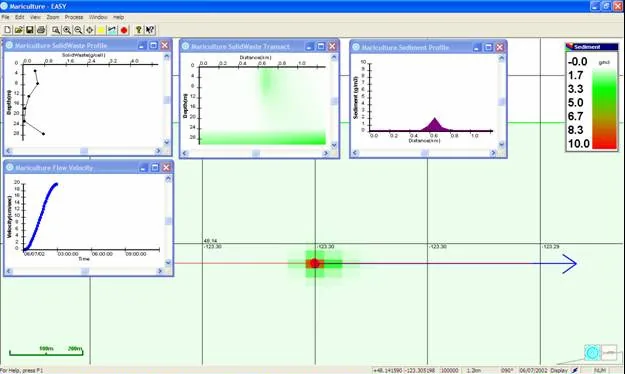
Figure B. Simulation output for a salmon farm as above but showing 10 cm/s current velocity carbon sedimentation output of a farm with very high fish loading density and 500,000 kg biomass with left to right plots of carbon vertical profile in the water column, carbon vertical profile along the centerline transect, sediment carbon status and current velocity shown below, left. Vector arrow shows instantaneous current direction.
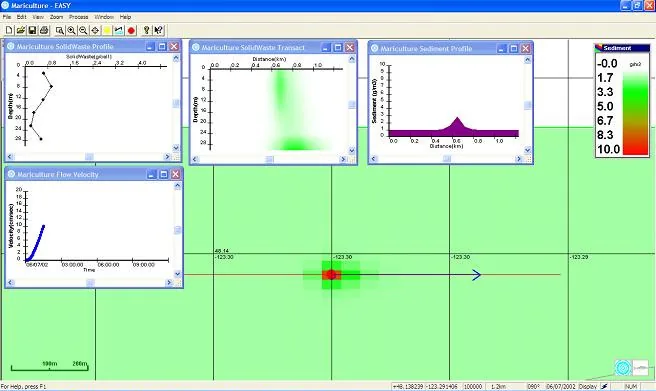
Figure C. Same as Figure B but current velocity now advanced to near 20 cm/s. This shows the effect of stronger currents on sediment resuspension and transport on the bottom.