
- Location
- Exposed coastal shelf off the east coast of Puerto Rico
- Farm
- Ten submerged SeaStation cages, about 405 metric tons of cobia (Rachycentron canadum)
- Prepared for
- Ocean Harvest Aquaculture Inc. and the National Oceanic and Atmospheric Administration
- Report
- Rensel, J.E., D.A. Kiefer and F.J. O'Brien. 2006. Modeling Water Column and Benthic Effects of Fish Mariculture of Cobia (Rachycentron canadum) in Puerto Rico: Cobia AquaModel. Final report, 60 pp.
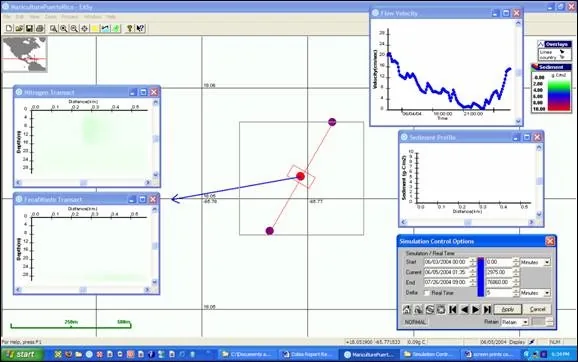
Figure 1. Typical higher current velocity screen print.
Top right velocity plot at 28 cm s-1; no carbon being deposited on bottom (right center plot) and very slight localized nitrogen plume along center of transect (left center plot). Blue line from center is a current vector (speed and direction) indicator.
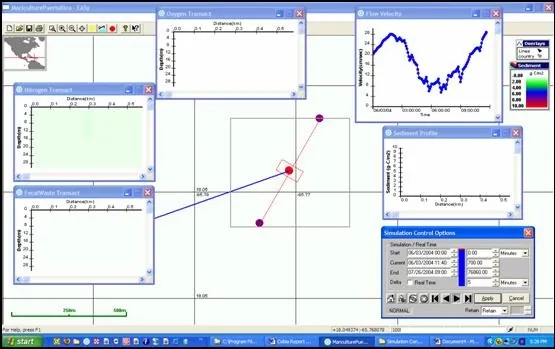
Figure 2. Later in same time series after a sustained period of slow velocity. Note faint shadow to NE indicating low level <0.2 g C/m^2 deposition graded toward edge of mixing zone.
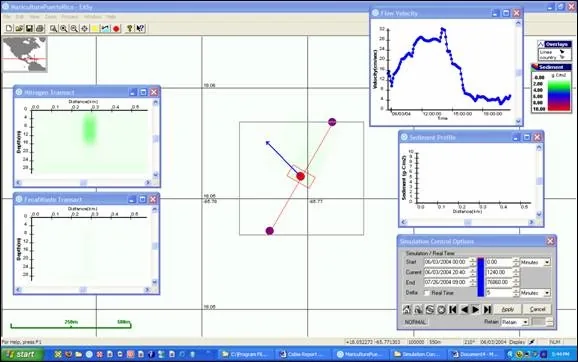
Figure 3. Much later in same time series with current direction reversal and maximum carbon deposition showing in main plot and in profile in right center (scale 1 to 10, purple mound indicating < 1 g C m-2 beneath simulated cage).
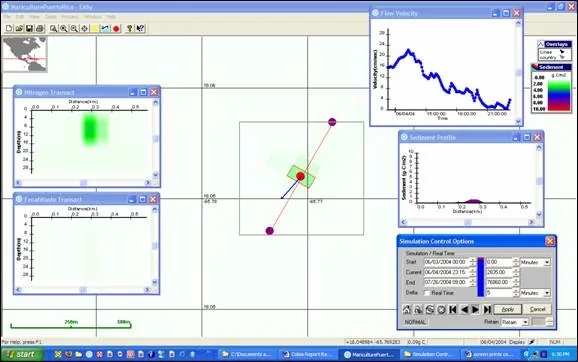
Figure 4. Stronger currents resuming and resuspension having removed temporarily deposited solids from the bottom.