
The EASy2 version of AquaModel was checked against the previous version on farms in California, Nova Scotia, France, Chile, Hong Kong, Oman and Hawaii. Fish weight, biomass, feed, oxygen, nitrogen and sediment carbon agreed within 0.1%. The additions below are the ones that matter most for farm studies.
The farm's own effect
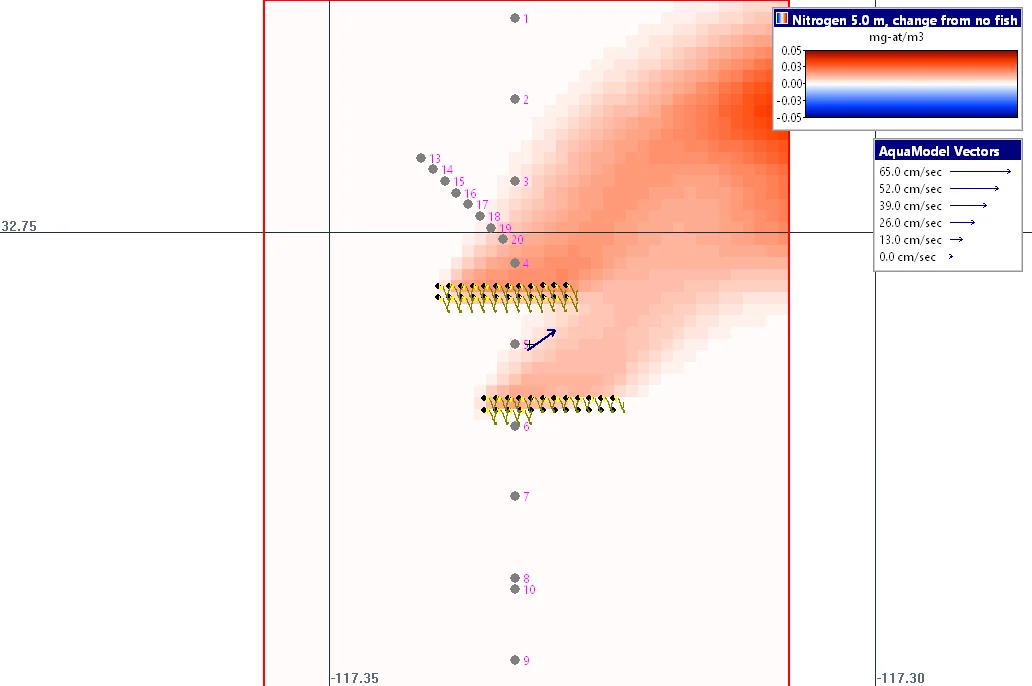
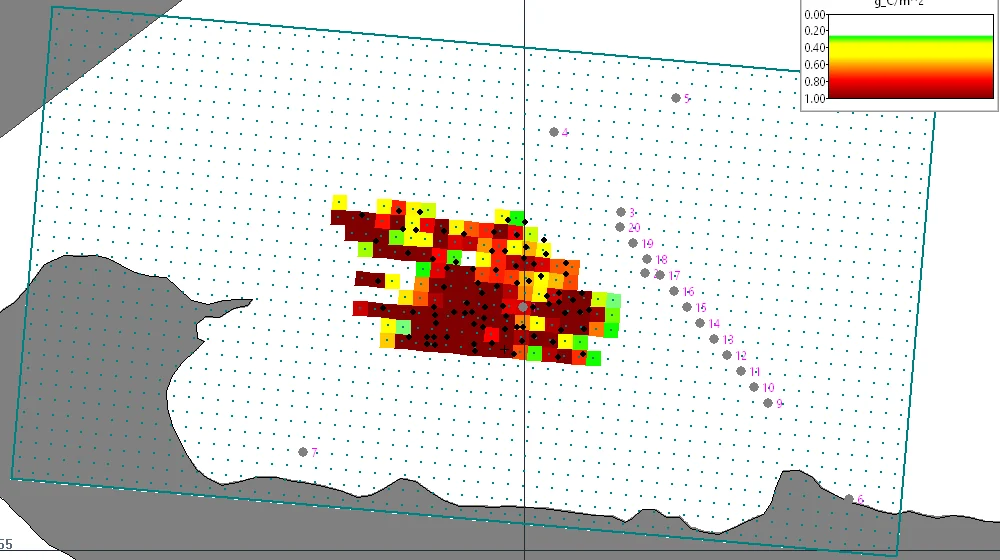
A farm can now be run a second time with every pen empty (the No fish option). When the farm's run is replayed, it can be shown as the change from the no-fish run, cell by cell, in the water and in the sediments, or as a percent change. This separates the effect of the farm from changes in the ambient water, which can be extremely useful in determining the true environmental impacts of a farm.
Starting from an existing sea bed
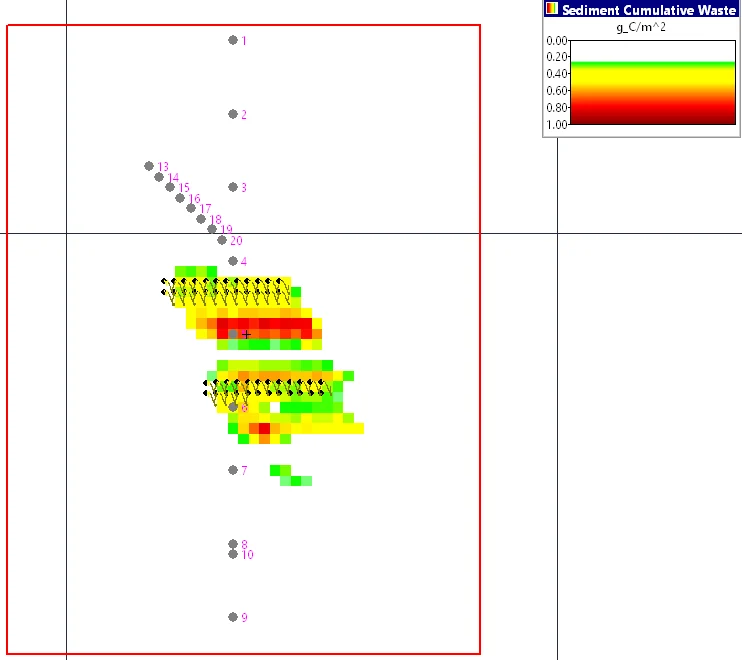
A site that has been farmed before does not start with clean sediments. A run can now start from the sea bed left at the end of an earlier run, including its waste carbon, bacteria, oxygen, sulfide and suspended layer. If the earlier run covers the previous production cycle, the new run begins with the waste that farming left under the pens.
Currents from FVCOM and DHI MIKE models
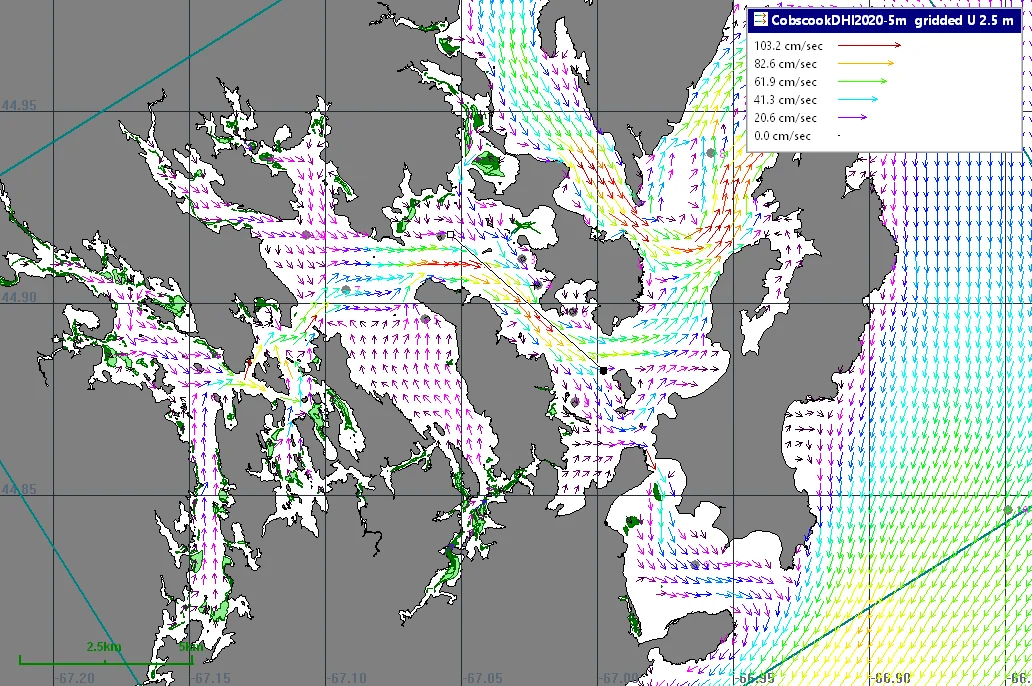
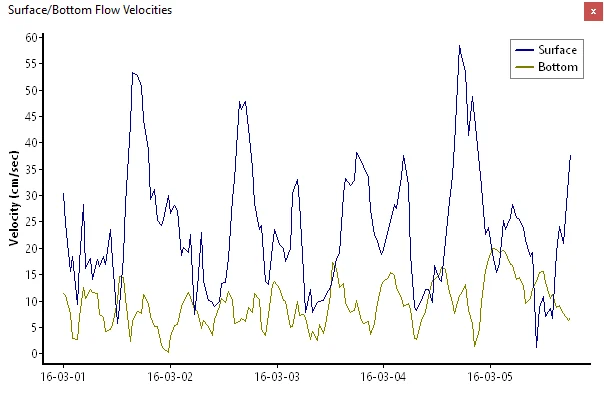
AquaModel reads the mesh output of FVCOM and of DHI MIKE 21 and MIKE 3 models directly, without regridding the model first and without DHI software. Each cell of the analysis array takes the model's current at its own center and at the middle of each of the farm's layers, following the tidal water level. The current over the sea bed can be taken from the model's lowest layer, and that current decides where waste settles and where it is lifted again.
Larger farms and more feed options
A farm can now have up to 256 pens. Pellets and raw fish can be fed together, each with its own carbon, water content, waste rate and sinking rate, and the raw fish waste is followed separately in the water and the sediments. Events files accept stocking, harvest, mortality, transfers between pens and feed rates in all the units the previous version did.
Output
Statistics files are plain CSV and can include a feed conversion ratio over the whole run. Each run keeps a log of its settings and progress. Plots and statistics can be shown in local time, and replaying a saved run writes new statistics for capture cells added after the run, without running it again.
The Drifter plug-in
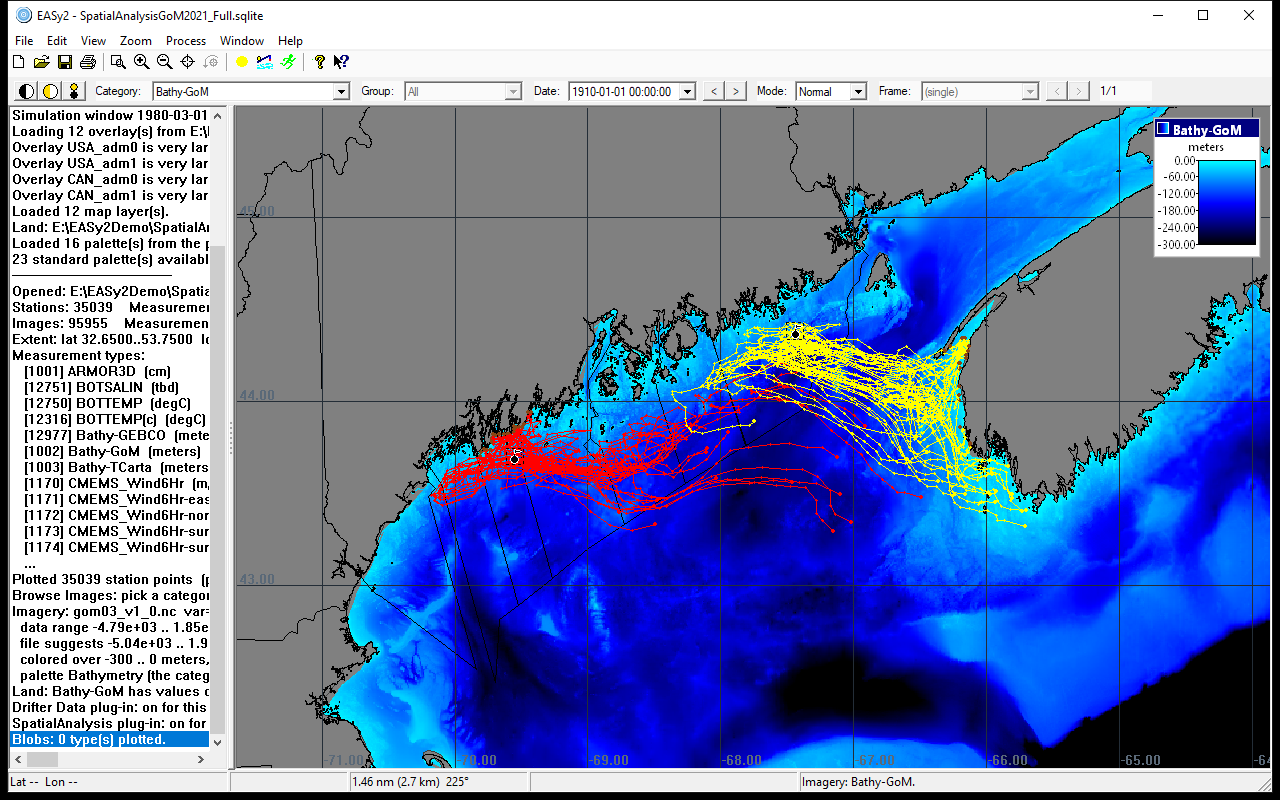
Drifters can be released from any site, such as a farm, and carried by the project's 2-D or 3-D currents, with wind, sinking, spreading and weathering as options. Drifting backward in time shows where water or material reaching a site came from.