New
Old

Revised AquaModel Mariculture Options Controls June 2013
These user interface improvements were prepared to simplify and expedite use by new AquaModel users. New (left) and old (right) versions of these controls are shown below with a brief description of some of the changes. Click on any image to see a larger, high-resolution version.
Behind these changes are several improvements in modeling strategy for dissolved oxygen dynamics, imagery use and interpretation and data storage and handling. Many of these changes are rooted in our continual efforts towards model validation and quality control.
AquaModel has become a full ecosystem model for the effects of aquaculture on single or multiple farm scales. We have shown we can simulate complex hydrographic regimes if ambient, boundary condition inputs are adaquate (e.g., O'Brien et al. 2011) and if sufficient data are not available, we provide the tools to make the best possible estimates.

AquaModel - now a plug-in of EASy
New User Controls


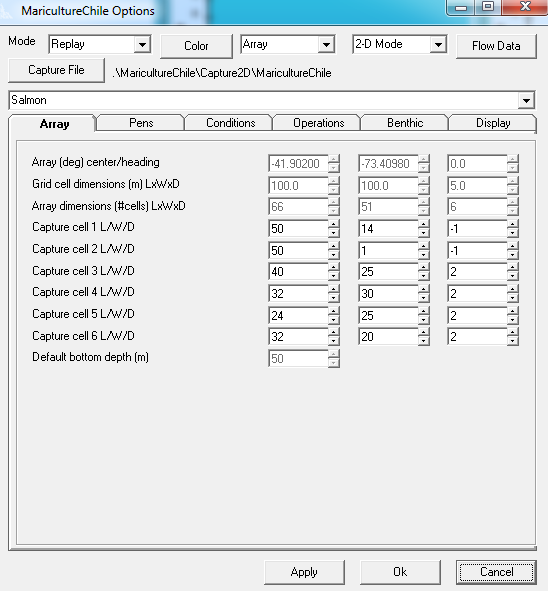
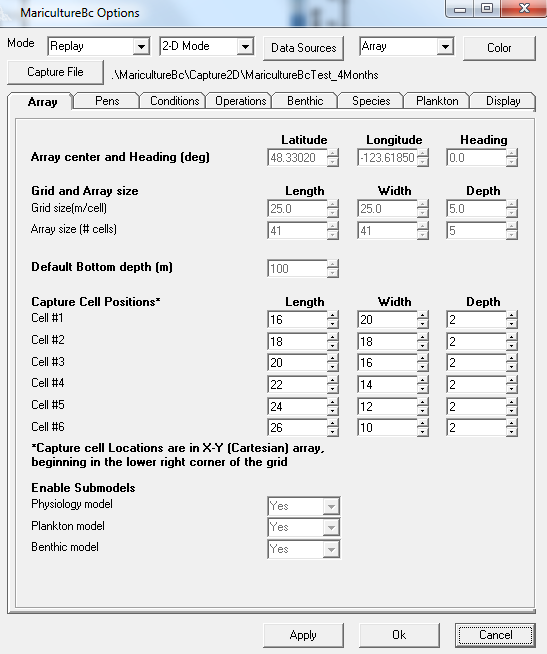
Array tab: For where geolocating is performed for the pens, default bottom depth, capture cell locations for storing spreadsheet data, and submodel controls in one location. Note column headers and reorganization into logical subcategories. The user may now select an array that extends to the bottom and have vertical profile plots for the entire water column.
New
Old
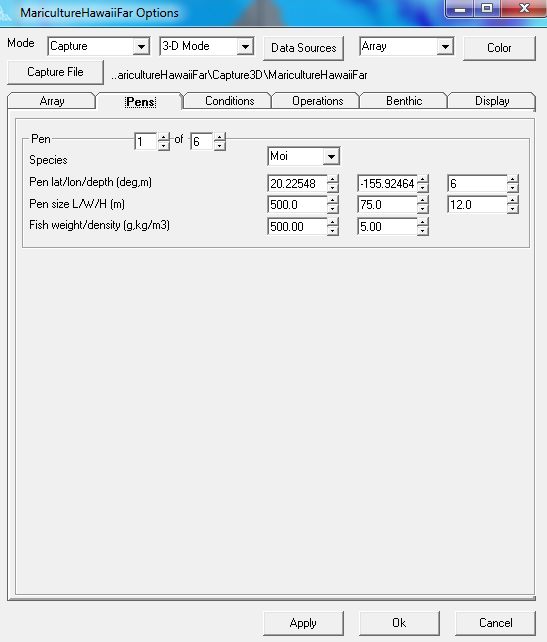
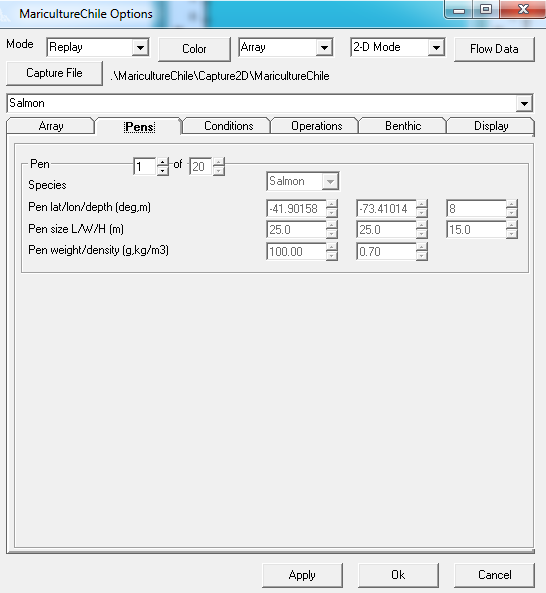
Pens Tab: No difference, although the third row of the old version of all the option screens has been removed as this was only to color code results for different species and was not commonly used.
New
Old
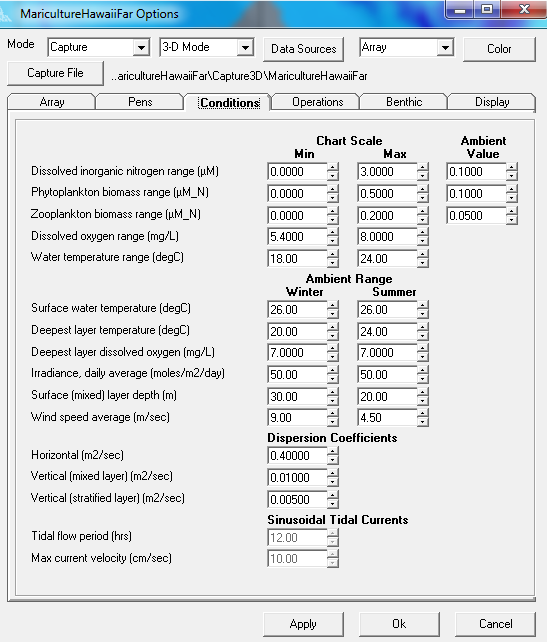
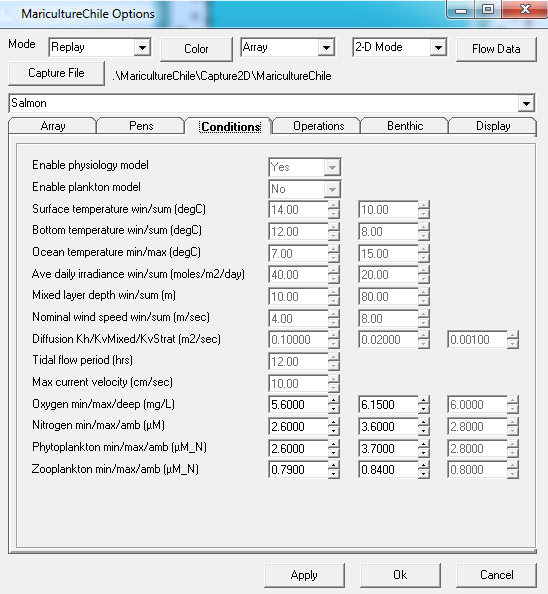
Conditions Tab: Headers provided for each column with groupings to indicate chart scaling ranges versus modeling operation input ranges. New controls for water temperature and deepest (stratified) water layer dissolved oxygen are set on a seasonal basis in the conditions tab or overridden with more frequent input in an ambient file. The deepest layer is the layer under the array defined in the "array tab". For example, if the array is focused on the upper ocean (e.g, 50m) but the site is offshore in very deep water (> 100m), a user may focus the analysis of water column properties on the shallower, near surface layers to 50m, and the deepest layer settings will provide the nessicary dissolved oxgen inputs to the sediments and to waters above, that are controlled via vertical dispersion coefficients (Kv).
Note that many of these factors are not needed for basic AquaModel operation, for example wind speed that is used to drive an optional atmosphere/sea surface oxygen flux submodel. Irradiance (sunlight) is only needed if the plankton model is invoked and inputs are readily available from worldwide on-line authorities. Dispersion coefficient settings are literature-based unless there is local data. We have revised and improved the simulated tidal current flow settings to be used in lieu of any current meter or 3D circulation data.
Note that many of these factors are not needed for basic AquaModel operation, for example wind speed that is used to drive an optional atmosphere/sea surface oxygen flux submodel. Irradiance (sunlight) is only needed if the plankton model is invoked and inputs are readily available from worldwide on-line authorities. Dispersion coefficient settings are literature-based unless there is local data. We have revised and improved the simulated tidal current flow settings to be used in lieu of any current meter or 3D circulation data.
New
Old
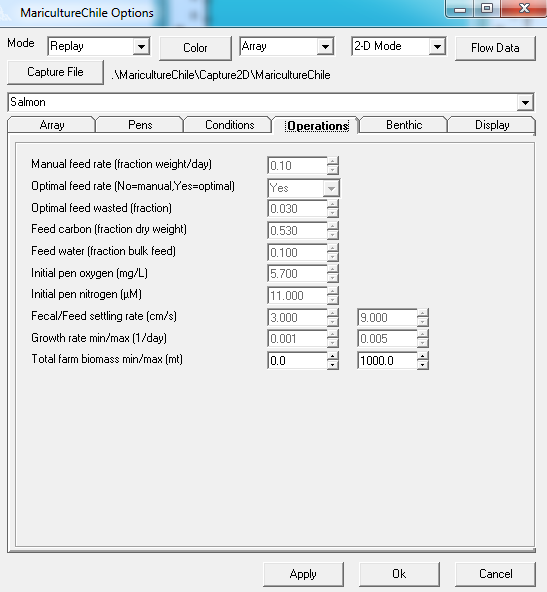
Operations tab: separates parameters into feed rate or feed composition options that include "optimal feed use" which allows AquaModel to allocate the exact correct amount of feed. Our growth rate for key species modeled have been checked and rechecked for fidelity to actual commercial growing operations throughout the world (e.g., salmon in Pacific Northwest and Chile). The user may then specify feed loss rates based on local knowledge that could include knowledge of feed use vs. FCR and other methods. AquaModel is now configured to let the user input feed volumes per pen per any given time period, using an "events" spreadsheet, as an option to circumvent the optimal rate option.
This tab also includes initial conditions for oxygen and nitrogen within pens, particulate matter settling rates for fish feces and waste feed and chart scaling ranges for growth rate and total biomass.
This tab also includes initial conditions for oxygen and nitrogen within pens, particulate matter settling rates for fish feces and waste feed and chart scaling ranges for growth rate and total biomass.
New
Old
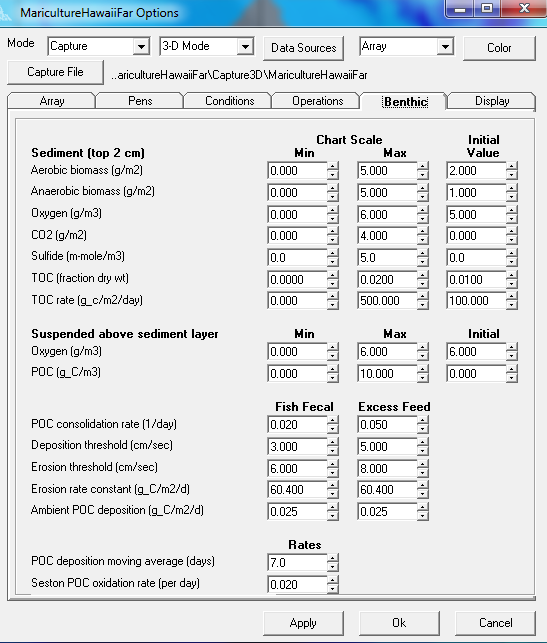
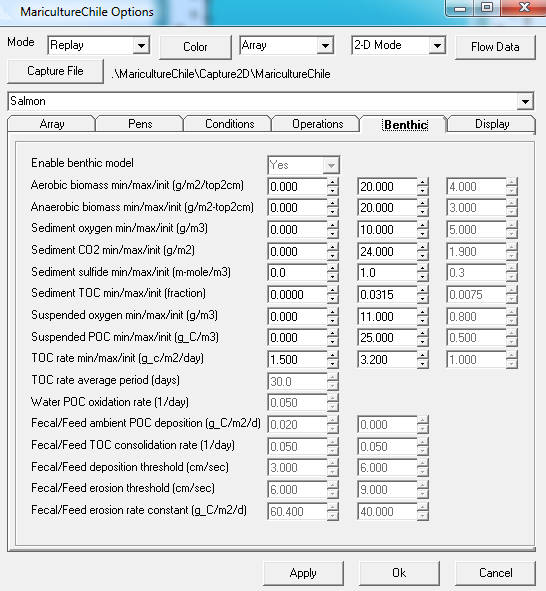
Benthic options: separated into chart scaling and initial values for surficial sediments, the suspended above seabottom layer, settings for fish fecal and excess feed rates and fates, and charting rates for POC moving average and seston POC oxidation (prior to sedimentation). These options are initially set for a single ecoregion and sediment type (e.g., the moderately coarse sands found in coastal shelf areas of the islands of Hawaii), then not altered by the user.
AquaModel remains the only fish farm model availble that allows complete tracking of fish feces vs. waste feed components, shown to be a major effect on benthic ecology. We also have measured or acquired settling rates for these components for all the fish species we model and provide those to our user groups.
AquaModel remains the only fish farm model availble that allows complete tracking of fish feces vs. waste feed components, shown to be a major effect on benthic ecology. We also have measured or acquired settling rates for these components for all the fish species we model and provide those to our user groups.
New
Old
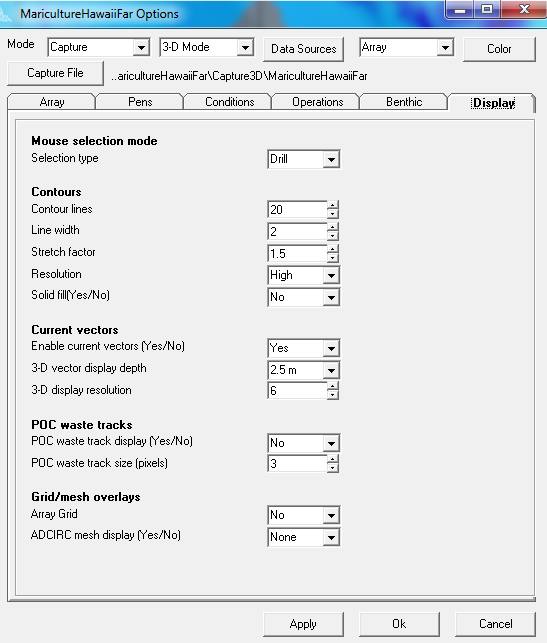
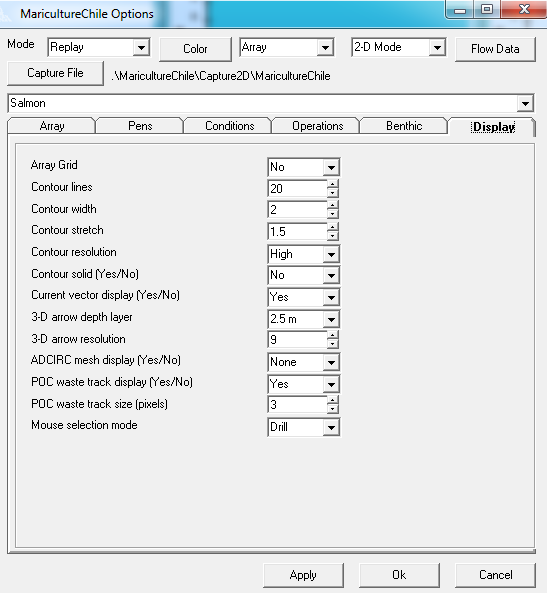
Display options: Reorganized into logical subcategories including computer mouse selection mode for vertical profiles ("drill") or select (for mouse cursor to hover-over and read outputs for plots, pen fish performance, bathymetry, etc.). Controls for current vector display, tracking particulate organic waste matter and display of model grid mesh overlays are included.
Data Source Input Controls ("Flow Field Options" within Mariculture Options)
Data Sources (available at top for all tabs, previously designated "Flow Data"):
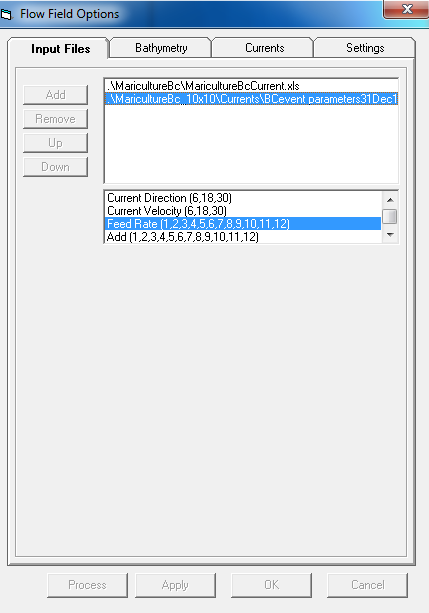
Input Files tab: For specifying ambient (boundary) file hydrographic data, Event files (fish farm loading, feed, mortality, move among pens, harvest, etc.) and current meter data for 2D operation.
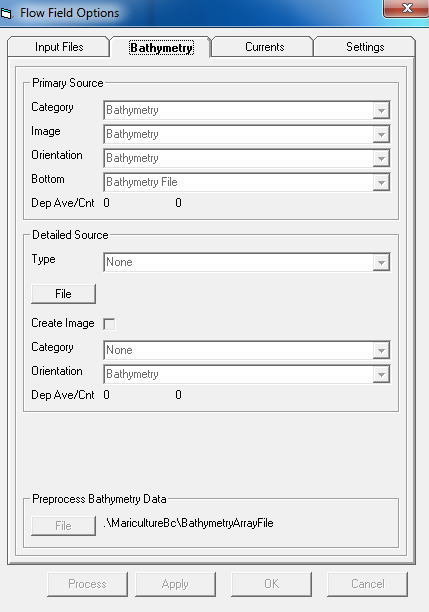
Bathymetry tab: AquaModel accepts bathymetry from simple, single depth designation (see "Default Bottom Depth" in the array tab), to ASCII files of latitude/longitude/depth as well as vector based imagery sources. As shown in the image here, the system allows blending of primary (coarse) and detailed (high resolution) sources to improve near field resolution near net pens for benthic effects determination while also allowing far-field bathymetry from readily available global sources used to simulate pelagic water column effects. For complex bathymetry sources, a utility to preprocess the data is provided that organizes the data into the grid used by AquaModel and creates a rapidly accessible file to allow faster project boot up and operation than if raw data were accessed upon each use.
Bathymetry tab: AquaModel accepts bathymetry from simple, single depth designation (see "Default Bottom Depth" in the array tab), to ASCII files of latitude/longitude/depth as well as vector based imagery sources. As shown in the image here, the system allows blending of primary (coarse) and detailed (high resolution) sources to improve near field resolution near net pens for benthic effects determination while also allowing far-field bathymetry from readily available global sources used to simulate pelagic water column effects. For complex bathymetry sources, a utility to preprocess the data is provided that organizes the data into the grid used by AquaModel and creates a rapidly accessible file to allow faster project boot up and operation than if raw data were accessed upon each use.
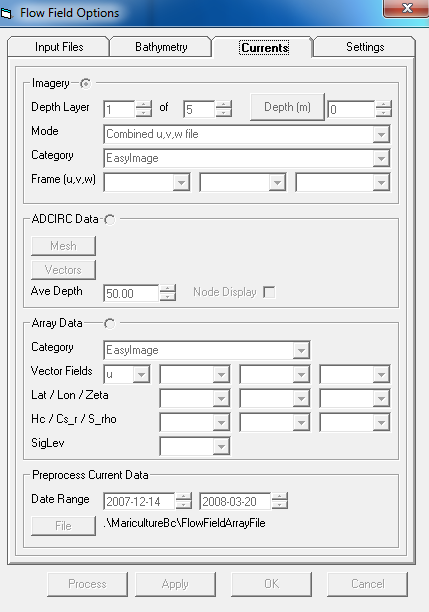
Currents tab: For 3D circulation from imagery, numerical or ADCIRC sources with preprocessing utility control at the bottom. Detailed instructions have been written on the use of these utilities. Because ocean circulation data sources can be highly complex and difficult to manipulate, the directions are very prescriptive. For new users, we offer assistance in this subject matter to expedite proper use. The system is designed to pre-process huge sets of circulation data to allow AquaModel to run on normal laptop and desktop computers without delays.
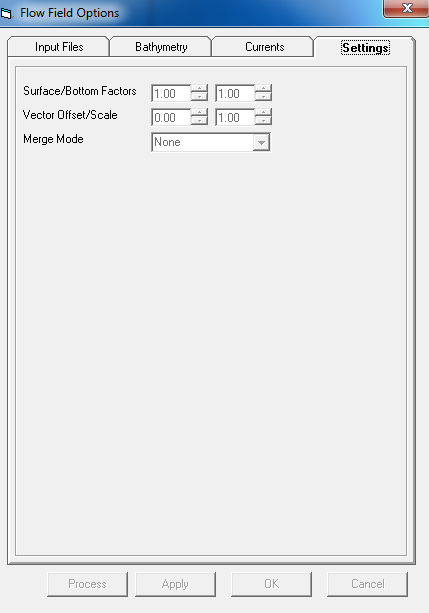
Settings tab: For manual override of surface to bottom flow velocity, vector offset/scale and merging of current meter with 3D circulation data. The merge mode allows the far field application of current velocity from a current meter record to far field 3D circulation data while maintaining current directions. This is useful when 3D data is of low resolution and in other special situations to provide meso-field circulation inputs for AquaModel. For example, if there are quality current meter data at one point, and it is clear the currents vary in direction and possibly velocity over scales of a kilometer, then it is advantageous to merge the flow velocity data into the more representative flow direction components.
Settings tab: For manual override of surface to bottom flow velocity, vector offset/scale and merging of current meter with 3D circulation data. The merge mode allows the far field application of current velocity from a current meter record to far field 3D circulation data while maintaining current directions. This is useful when 3D data is of low resolution and in other special situations to provide meso-field circulation inputs for AquaModel. For example, if there are quality current meter data at one point, and it is clear the currents vary in direction and possibly velocity over scales of a kilometer, then it is advantageous to merge the flow velocity data into the more representative flow direction components.