
Testing and Validation
Testing and validation of simulation models is highly important. It provides:
1. Feedback on how well the model performs
2. How it should be altered to improve accuracy in specific locations or cases
3. Highlighting of naturally occurring bottlenecks in simulation of biological processes
4. Incremental determination of less than optimal model performance
AquaModel has been subjected to various types of validation as follows:
The fish physiology submodel has been compared to the extensive laboratory and field literature for salmonids and found to faithfully reproduce oxygen and dissolved nitrogen fluxes. One of us has collected extensive field data in this regard, including up and downstream of fish farms in the Pacific Northwest (a small portion is shown in WDF 1991). We also work with colleagues in other venues (e.g., Maine) who have reported similar and much more extensive measurements of dissolved oxygen flux from commercial fish farms.


AquaModel - now a plug-in of EASy
Solutions


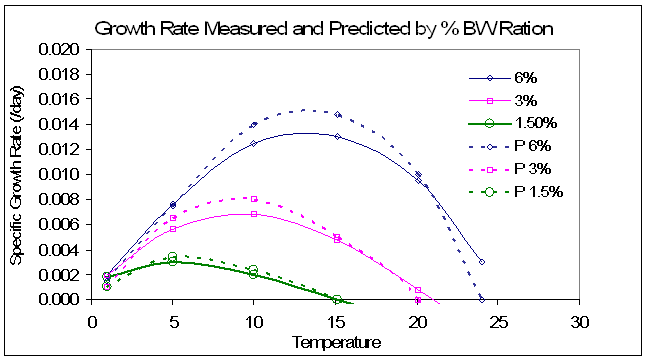
An example of the type of validation we have performed includes this plot that shows predicted (dashed lines) and measured (solid lines) growth rates for young sockeye salmon grown at different temperatures (abscissa) and different feed rates (legend). The growth rates are in units of the fractional change in body weight per day, and the feed rates of 6%, 3% and 1.5% of body weights per day. Note that the model accurately predicts the decreases in the temperature of optimal growth with decreases in feed temperature.
For the hydrodynamic model we have also conducted Lagrangian (drogue) surveys with paired-released drogues downstream of commercial fish farms to study horizontal dispersion of water using dGPS locating equipment. Our data compares closely with literature values being reported for the first time recently and we are aware of the range of diffusivity that may occur with differing types of net pen structures.
The plankton submodel is a system of interlinked equations to characterize the dynamics of the planktonic community. It traces the cycling of carbon, nitrogen, and oxygen within each element of the array, both within the farm and the surrounding waters, and output from the model (Kiefer & Atkinson, 1984). Outputs consist of the time series at each element of the array of the concentrations of dissolved inorganic nitrogen, carbon dioxide, and oxygen, as well as the organic nitrogen and carbon in the phytoplankton and zooplankton. The model displays predator-prey oscillations that dampen with time, reaching a steady state. Typically it is hard to stimulate a bloom from operation of a single farm in most environments but large numbers of farms could do so.
The plankton submodel is a system of interlinked equations to characterize the dynamics of the planktonic community. It traces the cycling of carbon, nitrogen, and oxygen within each element of the array, both within the farm and the surrounding waters, and output from the model (Kiefer & Atkinson, 1984). Outputs consist of the time series at each element of the array of the concentrations of dissolved inorganic nitrogen, carbon dioxide, and oxygen, as well as the organic nitrogen and carbon in the phytoplankton and zooplankton. The model displays predator-prey oscillations that dampen with time, reaching a steady state. Typically it is hard to stimulate a bloom from operation of a single farm in most environments but large numbers of farms could do so.
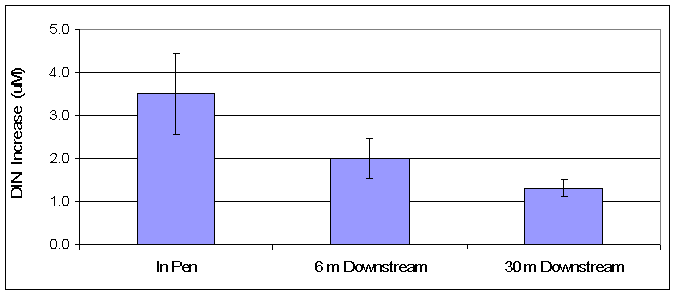
Mean and SE dissolved inorganic nitrogen increase in pens and downstream vs. upstream (ambient) as an example of the type of data we use to validate the dispersion and nutrient production aspects of AquaModel (N = 12 in this case).