
Puerto Rico
Cobia Farming in Puerto Rico
The following figures exhibit the use of AquaModel with screen prints from 5 minute increments of a month long model run for a study site in exposed, open ocean waters near Puerto Rico. A few of the available XY plots and transects are shown below and the main figure indicates sedimentation of farm-source carbon on the sea bottom. Read More...

AquaModel - now a plug-in of EASy
See it in Action - Case Studies


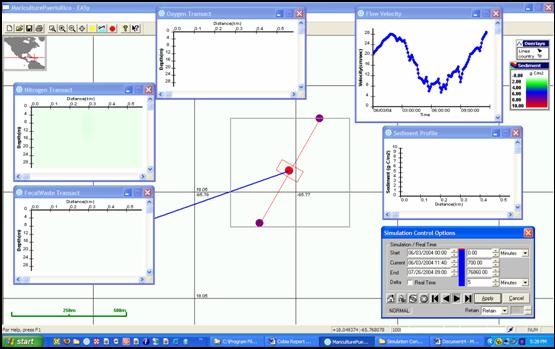
Figure 1. Typical higher current velocity screen print.
Top right velocity plot at 28 cm s-1; no carbon being deposited on bottom (right center plot) and very slight localized nitrogen plume along center of transect (left center plot). Blue line from center is a current vector (speed and direction) indicator.
Top right velocity plot at 28 cm s-1; no carbon being deposited on bottom (right center plot) and very slight localized nitrogen plume along center of transect (left center plot). Blue line from center is a current vector (speed and direction) indicator.
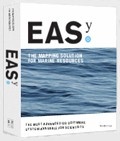
Figure 2. Later in same time series after a sustained period of slow velocity. Note faint shadow to NE indicating low level <0.2 g C/m^2 deposition graded toward edge of mixing zone.
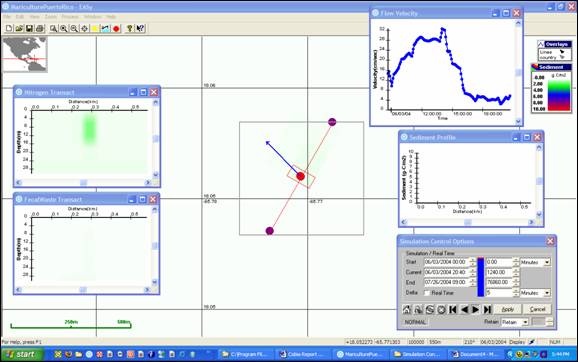
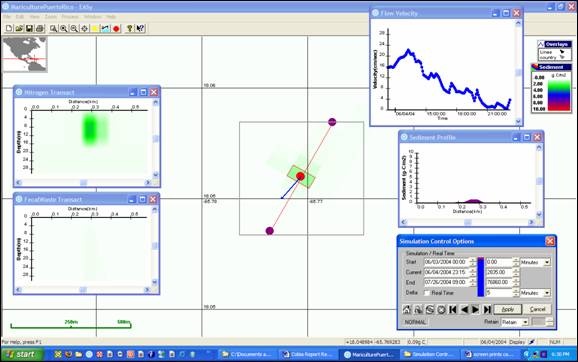
Figure 3. Much later in same time series with current direction reversal and maximum carbon deposition showing in main plot and in profile in right center (scale 1 to 10, purple mound indicating < 1 g C m-2 beneath simulated cage).
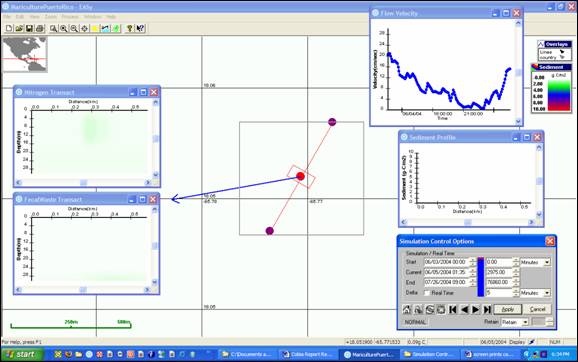
Figure 4. Stronger currents resuming and resuspension having removed temporarily deposited solids from the bottom.